The consumer price index (CPI) is the best measurement of inflation experienced by consumers. The CPI is representative of the types of goods and services the average US consumer purchases. Since 1913, the Bureau of Labor Statistics (BLS) has been recording the CPI-U (CPI for all urban consumers (a group that is representative of 87% of the US population)). This article will only consider the CPI-U.
Below is a plot of the CPI-U from 1913-2009 :
Not surprisingly, things have gotten more expensive over the past century. This is because of inflation. Annual inflation rates can be calculated by comparing consecutive CPIs (the below equation is only valid for consecutive years):
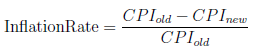 For example, in 2007, the CPI was 207.3; in 2008, it was 215.3. (215.3-207.3)/207.3 = 3.86%/year.
To predict future prices, it would be nice to have an estimate of the average inflation rate. To that end, I have calculated the inflation rate for every 12 month period (not just Jan - Jan, but also Feb - Feb, etc.) from 1913 to the present. I then calculated the geometric mean (thanks to Cyrus) of 12 month inflation rates from those numbers and got 3.26%/year. You can see a histogram of the result below:
As you can tell, there's actually a fairly large spread in the inflation rate (the standard deviation is 5.22%/year). This means that 3.26%/year does a bad job predicting the future over the short term; however, over the long term (when all the fluctuations have settled down), 3.26%/year should provide a good prediction.
Copyright © 2009 Peter Dolph


4 comments:
Peter, what kind of average did you use? I think the best way to analyze this is with a geometric mean, because inflation compounds through multiplication and not addition. Or, knowing the CPI numbers for the start and end years, you can use the following equation:
inflation rate = (CPIend/CPIstart)^(1/years) - 1
By this method, I calculate inflation from 1913-2009 as averaging 3.24%, which is a bit lower than your 3.86%.
Cyrus,
I calculated the inflation rate for every consecutive 12-month period from Jan 1913 through Sept 2009 (That's 12*(2008-1913)+9 = 1149 intervals). I then took an arithmetic mean which gave 3.39%/year (not 3.86 -- that number was from an example calculation). If I use the same data set and instead analyze with a geometric mean, I get 3.26%/year.
I think you're right to use a geometric mean because (as you say) inflation is exponential in nature (although the numbers agree to 4%).
How did you get 3.24%/year? Did you take the average CPI from 2009 and the average CPI from 1913 and calculate directly from those two numbers? I chose to look at every 12-month interval (instead of just looking at 2009 and 1913) because the choice of those two years is somewhat arbitrary.
Yeah, I used start and end months. Using 12 month periods doesn't make much of a difference other than underweighting the first 11 months and the last 11 months.
Both methods agree well over the long term:
http://i945.photobucket.com/albums/ad298/gandolph_photos/difference.png
Post a Comment